This process can be streamlined by automating a report. The data still needs to be reviewed but at least getting to that point can be automated.
We’re going to walk through how to create a dashboard to track pageviews for your top five articles. We’ll track the traffic based on the article published date. We’ll review all pageviews and specifically monitor traffic from 30 days, 60 days, and 90 days after publish.
Here’s an example of what the final dashboard will look like:
At the end of this tutorial you’ll have the information you need to duplicate this dashboard for yourself. Hopefully, you’ll also have a better idea of what is possible when you combine Google Analytics with Google Sheets and Data Studio. That way, you can modify this tutorial to work with your business goals.
Don’t want all the details? Just want the template? Here you go! You’ll need both of these.
One of the tricky pieces to this puzzle is the reports will be based off of the article publish date. Since we need to determine data based on the publish date we need to add this information into Google Analytics. To do this we’ll setup a custom dimension.
To setup a custom dimension I recommend using Google Tag Manager. If your Google Analytics tracking is already setup using Tag Manager than it makes perfect sense to use Tag Manager to implement the custom dimension as well. If not, this is a good time to consider moving your Google Analytics install to Tag Manager.
If you don’t want to (or can’t) use Google Tag Manager to implement the custom dimension than you will need a javascript developer to assist. The process we’ll walk through is specific to Tag Manager but a javascript developer can apply the process directly to your website.
Before we go into the step-by-step process I want to give credit to a few helpful websites.
When I started this process I referenced the guide found on UpBuild. It’s a great guide but the first step is to use the class name on the date field. Since my date field didn’t already have a class or ID, I decided to use the meta information.
To add custom javascript to track meta information I found a tutorial on Lynuhs. This showed how to capture author information from a meta tag. I was able to make a few modifications to capture the date and time information instead.
Now, we’re ready to add our custom dimension.
Step 1: Find the tag you want to track.
Right click on an article on your website and click view page source.
On the source code page, press ctrl+F to search for the word time in the code.
If you have a WordPress blog, you should see the following two meta tags with a date. <meta property="article:published_time" content="DATE HERE"> <meta property="article:modified_time" content="DATE HERE">
(If you don’t use WordPress the meta tags may look different than above.)
Step 2: Create a variable in Tag Manager.
In Tag Manager navigate to Variables and click New under User-Defined Variables.
Click the Variable Configuration box to edit and select Custom JavaScript.
To track the most recent update date with WordPress use the following JavaScript:
function (){
var metaName = "article:modified_time";
var metas = document.getElementsByTagName('meta');
var content = undefined;

for (i = 0; i < metas.length; i++){
if (metas[i].getAttribute("property") == metaName){

content = metas[i].getAttribute("content");
}
}
return content;
}
(If you want to track the original published date instead of the updated date than replace modified_time with published_time.)
Press Save and name your variable Post Date.
Step 3: Create a Custom Dimension
In Google Analytics go to the Admin section (click the gear icon in lower left).
Under Property click on Custom Definitions > Custom Dimensions.
Click New Custom Dimension.
Configure your custom dimension:
Name your dimension “Post Publish Date”.
Keep the scope set to Hit.
Make sure the active checkbox is checked.
Click Create.
Once you’re back on the custom dimension summary page take a look at your new dimension. Look at the Index column and make a note of what index number corresponds with your new custom dimension.
Step 4: Add Dimension to Google Analytics Tracking Tag
In Tag Manager go to Variables.
Select your Google Analytics settings variable under the User-Defined Variables. The name will vary depending on how it was named when first configured.
Click in the Variable Configuration section to edit it.
Under More Settings > Custom Dimensions enter in the new dimension you created.
Under Index enter the number found in the Index column in Google Analytics.
Under Dimension Value click the icon to the right of the field to select the Post Date variable you created in Step 2.
Click Save.
Step 5: Preview and Publish Your Changes
In Tag Manager, click Preview.
Navigate to an article on your website.
In the Preview pane at the bottom click 2 DOM Ready on the left.
Then, click Variables at the top.
Scroll down until you see the Post Date variable. You should see the article date to the right.
If everything looks good with the preview, go back to Tag Manager and click Publish!
Now you have a custom dimension set up that tracks your article publish date. Next, we’ll pull all of our data into Google Sheets. Once we do that we’ll go over how to make it pretty with Google Data Studio.
Pulling Google Analytics Data into Google Sheets
To pull Google Analytics Data into Google Sheets you’ll need the Google Sheets Add-On. This add-on allows you to connect your Google Analytics profile and pull your data directly into a Google Sheets spreadsheet.
First, we’ll discuss how to setup the spreadsheet at a high-level. Then, we’ll provide a link to the template and directions to get started with the template.
Pull Your Article Content to Analyze
The first report you’ll grab from your Analytics data contains a list of your content. I choose to do a timeframe of the last year. So, the report looks at 365 days ago until today.
I pulled a metric of pageviews and the dimensions of page path and our custom dimension. What that means, is the report will list out the URLs (page path) and the publish date (our custom dimension) and display the number of pageviews (the metric).
When you run this report it provides a big list. And when you review it you may notice a few issues. You likely have duplicate URLs. If you have various URL parameters appended to your URLs (such as ?fbclid=abcdefg) to track campaigns you’ll see all of those variations.
Also, you’ll notice we have the date but it’s difficult to read and includes a time.
We have the data, but it needs to be cleaned up.
Create a Worksheet to Clean Up Your Data
Have no fear, we can clean this up. We don’t want to override the data that gets pulled automatically from Google Analytics so we’ll create a new sheet.
We can use REGEXREPLACE to remove any URL parameters so we’re left with the part we care about. Here is an example of the formula:
=REGEXREPLACE(Content!A16,"(.*)\?.*","$1")
This basically says look at all content in the specified cell until you see a question mark. Then only display the first content that was found prior to that question mark. Since URL parameters begin with a question mark this was what we choose to clean up the URLs.
We’ll use a similar method to clean up our dates.
Instead of a question mark, all of the information in the date that we want to remove comes after a T. So we’ll change the question mark in our formula to a T:
=REGEXREPLACE(Content!B16,"(.*)T.*","$1")
We’ll also copy the pageviews to our new sheet so all of the information is together.
Now our data is clean, but we have a lot of duplication. Time to consolidate our data.
Consolidate the Clean Data
To consolidate this data we’ll create another sheet. On this sheet we’ll add a pivot chart. For the rows in the pivot table use the Page and Post Date dimensions from the previous worksheet. For the value, we’ll use the sum of pageviews.
Make sure your Post Date is formatted as YYYY-MM-DD. This will be important for Google Data Studio and ensures that Google Sheets sees it as a date field.
On your pivot table sheet we’ll want to add three columns. We want to calculate the date for 30 days, 60 days, and 90 days after publish. If your Post Date is formatted as a date calculating the other dates is as easy as adding 30, 60, and 90 respectively.
Add Reports for Top Content
Now that we have our list of top content we can add several more reports. Go back to the main Report Configuration tab.
We want to pull several more reports from Google Analytics. For each article you want to track we want to pull a report for 30 day, 60 day, 90 day and all time performance. So, if we’re tracking the top five content pieces we add 20 reports.
For each of these reports we’ll add dynamic information based on our pivot table. That way, as content is updated and changing we don’t have to update our report settings.
The start date will be the article published date. The end date will be either the 30 day, 60 day or 90 day date. Or, for all time data it will be set as today.
We’ll want to pull the pageviews metric for all of the reports. And for dimensions we will want both the URL (page path) and the date. Without the date we’ll just get a total number and we won’t be able to add a graph to visualize the trend in Data Studio.
We will also want to add a filter to these reports. We want to filter the data to only look at the one page we are concerned about. To do this we can add ga:pagePath=@[your content url] in the filter cell. The =@ operator means it needs to contain the following.
Run and Schedule the Report
One you have everything set up you can run the report. To keep the data updated you’ll want to schedule the report to run on a daily or weekly basis. These settings can be found under Add-ons > Google Analytics.
Using the Google Sheets Post-Publish Content Review Template
To get your View ID we’ll create a new report. Go to Add-ons > Google Analytics > Create new report.
Name your report anything. Then, make sure you select the Google Analytics view you want to grab data from. You can leave the other fields blank and click Create Report at the bottom.
The new report will be added to the last column (column W). Go to it and copy the View ID.
Copy the View ID number into every report in the View ID row (columns B-V).
Delete the new report you added (column W).
Step 3: Run Reports
Before you run the reports, verify the dimension index is correct. Under the dimensions in the first report (cell B7 on the Report Configuration tab) you’ll see we’ve specified dimension1. Change the dimension number to match the index number for your custom dimension in Google Analytics. So, if your custom dimension is in index 3 change ga:dimension1 to ga:dimension3.
To run your report go to Add-ons > Google Analytics > Run report.
The first time you run it only one report will run successfully (the Content report). This is because the other reports rely on data collected in the first report.
If this is the first time you’ve ran the report click OK on the error message.
Then, navigate to the Data sheet (tab named Data at the bottom).
Wait for the data to populate in the pivot table then navigate back to the main Report Configuration tab.
Run the report again by going to Add-ons > Google Analytics > Run reports.
All of the reports should have completed successfully. Click OK to close the dialog box.
Step 4: Schedule the Reports
To make the process automated we will schedule these reports to run. That way you don’t have to come back to the spreadsheet and manually run the reports any time you want to review data.
To schedule the reports to run go to Add-ons > Google Analytics > Schedule reports.
Check the checkbox next to Enable reports to run automatically.
Select the timeframe that matches the frequency you need.
Click Save.
Visualizing the Google Sheets Data with Google Data Studio
Once you have the data you want to make it easy to look at. Data Studio is the perfect solution. You can integrate your Google Sheets document and with a few clicks make the data beautiful.
You’ll want to create a new dashboard in Data Studio. Once you do that you’ll need to import your spreadsheets.
Import Your Data
You don’t need to add every sheet from your document. Instead, only import sheets with data you want to add to a chart. I consolidated all of the data I needed into one sheet (the sheet named Data) so that is the only one I’ll import.
When you import your data into Data Studio make sure to verify the field type is correct. You want to make sure any date fields are set to Date and not Number or Text.
Add Your Charts
Once your data is imported you can start adding your charts. You’ll see the Add a chart dropdown at the top. Choose the chart you want to use to visualize your data. If you aren’t sure, play around with the different options.
I choose to use a Table chart at the top with the data from my pivot table. Then I combined Scorecards with Time Series charts to display the data from the top content.
Using the Google Data Studio Top Content Performance Template
Click the Select a datasource dropdown and scroll down to the bottom and click Create New Data Source.
Scroll down to Google Sheets and click Select.
Select your Content Summary spreadsheet.
Under Worksheet, scroll down and select Data.
Keep Use first rows as headers checked.
Click the Connect button in the top right.
Change the Post Date field to a YYYYMMDD date format.
Review field format for each field. Everything other than Post Date should populate properly.
Click the Add to report button in the top right.
Now you should be back at the template preview screen. Click Use Template again.
You can now select your spreadsheet in the Select a datasource dropdown. Select it and click Copy Report.
That’s it! Now you have your dashboard to track 30, 60, 90 day content performance.
A Few Notes
Data Only Pulls Items with the Custom Dimension
If you’ve just set up your custom dimension to track published data your data may not look accurate. This system only pulls content if it finds our custom dimension associated with it. So, you may have to wait and gather data before you see the data you want to review.
Data May Look Incomplete If You Update Often
I update my content all the time because every time I post a new article I add internal links wherever it is relevant and useful. If you update often you may find not very many top content articles have data for 60 and 90 day periods.
For my data, I’m okay with that. If that doesn’t make sense with your goals you may want to change the custom dimension to track the original published date instead of the updated date.
How did this system work for you? Did you make any modifications? Let us know in the comments!
Google Analytics is an amazing tool and can help with content marketing. But, it can be overwhelming in the beginning. We’ll go over seven important Google Analytics metrics that you’ll want to track for your blog.
What is a Metric in Google Analytics?
A metric is a unit of value to describe various elements. The various elements are referred to as dimensions.
Metrics vs Dimensions
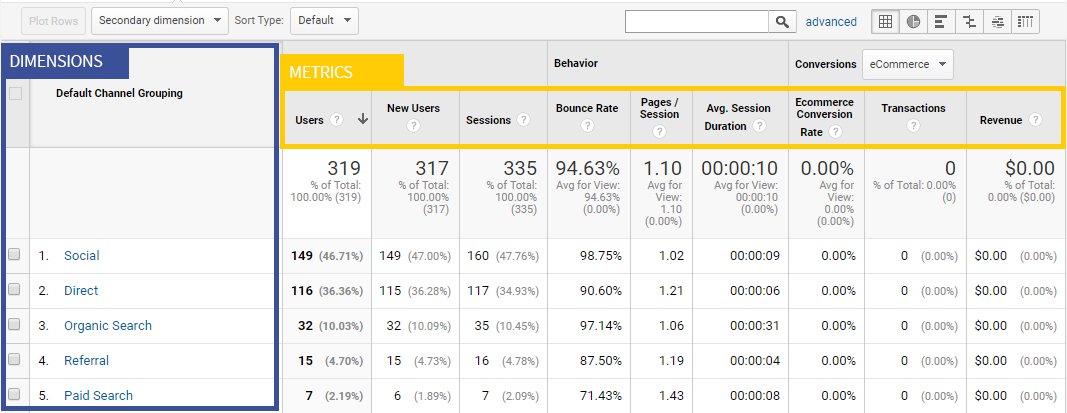
Metrics are values. Dimensions are descriptors or categories. In Google Analytics, metrics are displayed in columns in the right hand side. Dimensions are listed in rows on the left hand side.
Important Google Analytics Metrics to Track Content
Any time you’re reviewing Google Analytics data be sure you understand what question you’re trying to answer with data. If you have a clear question in mind you’ll have a better idea of which metrics you should review.
Finding these Metrics in GA4
These metrics were originally put together with Universal Analytics in mind. But GA4 is the future of Google Analytics. If you’re like me, you’re a little lost in GA4 because many of the go-to metrics are missing. Well, the data is there but different. It can get confusing. But once you start to figure it out, it makes a lot of sense.
I’ve updated this list of metrics that was originally intended for Universal Analytics and identified the corresponding GA4 metric to monitor. I thought this could be a good bridge for people who, like me, are a little nervous to start using GA4 as your default Google Analytics profile. At first glance it seems like the majority of these important metrics are missing from GA4, but when you really dig into it you’ll find some great data to answer the same questions.
Question: Is traffic growing?
Metric: Users
Reviewing the users metric will indicate if the traffic is growing. The more users you have the more traffic.
In the Universal Analytics version of Google Analytics this metric is easy to view under Audience > Overview. It is also one of the default metrics included in almost every report in Google Analytics.
In Google Analytics 4 (GA4), you can view this information on the Reports snapshot screen or under Acquisition > Acquisition overview.
Question: Do users like what they see?
Metric: Bounce Rate OR Engagement Rate
You want your bounce rate to be low. If your bounce rate is at 100% that means every single person that visited the website immediately left. Meaning, it wasn’t a good fit for their needs.
In Universal Analytics this can be found under Audience > Overview. In GA4, there isn’t a bounce rate metric, instead GA4 shows the engagement rate. (Engagement rate is new for GA4 and isn’t in Universal Analytics.) Engagement rate is essentially the opposite of bounce rate. Instead of showing how often people left, it shows how often they engaged. Unlike bounce rate, you want engagement rate to be high. You can view engagement rate under Acquisition > User acquisition.
Metric: Pages / Session
You want the pages / session metric to be higher than 1. If it’s higher than that means people are looking at more than just the initial page they landed on.
In Universal Analytics this can be found under Audience > Overview. In GA4, there isn’t a pages / session metric. Instead, take a look at Views per User. This can be found under Engagement > Pages and screens. At the very top of the Views per User column you’ll be able to see the site average.
To encourage readers to view multiple pages remember to include internal links towards the top of your articles.
Metric: Avg. Session Duration
The longer your readers remain on your website the more likely they are a qualified visitor. If they spend more time it shows the content is relevant and useful to their needs.
In Universal Analytics this can be found under Audience > Overview. In GA4, there isn’t an average session duration metric. Instead, take a look at Average engagement time. This can be found under Engagement > Engagement overview.
Metric: New vs. Returning Visitors
Monitor your new vs returning users. Gaining new users is great, but if those users don’t return then you have a problem. Either the new users you are getting are not the correct demographic, or they don’t understand how you can help.
In Universal Analytics this can be found under Audience > Behavior > New vs Returning. In GA4, it’s on the Retention screen.
Question: Where are users coming from?
Report: Channels
Okay, so this is best answered with more than a metric. In Universal Analytics, if we look at the report under Acquisition > All Traffic > Channels we can view the users by acquisition source. In GA4, you can view this data under Acquisition > Traffic acquisition. This helps you understand not only how many users visit your website, but where they came from.
Question: Are they converting?
Metrics: Goal Completions and Goal Conversion Rate
Having traffic and long sessions is great, but if those users aren’t converting they’re doing you no good.
In Universal Analytics, make sure you set your goals in Google Analytics. Then you can view the goal metrics in the Conversions > Goals > Overview report to track the results.
In GA4, the idea of goals has been re-worked. You no longer have to create specific goals. You simply have conversions. And any event can be toggled as a conversion. And since GA4 tracks every single thing as an event, including pageviews, that means anything can be set as a conversion. To view conversion data you’ll navigate to Engagement > Conversions.
Tracking your data in Google Analytics is a great way to understand the value of your website. Don’t let the data overwhelm you. Start with these basic metrics and questions.
What is your go to metric to measure the success of your blog? Please share it in the comments!
Do you want to listen to this article? Here’s the podcast episode:
Tracking your website data with Google Analytics is a must. But, it will do you no good if you don’t understand the metrics. Knowing where people leave your site is a good place to start. So, let’s discuss bounce rate vs exit rate.
The percentage of single-page sessions in which there was no interaction with the page.
Bounces are sessions where a user visits your website and then leaves. They don’t interact or continue. Instead they close the window, type a new URL in the browser address bar, or click the back button.
Google defines exit rate (% exit) as:
The (number of exits) / (number of pageviews) for the page or set of pages. It indicates how often users exit from that page or set of pages when they view the page(s).
So, what that means is bounce rate is the percentage of people who visited the page and immediately left. Whereas, exit rate is the percentage of all exits from that page.
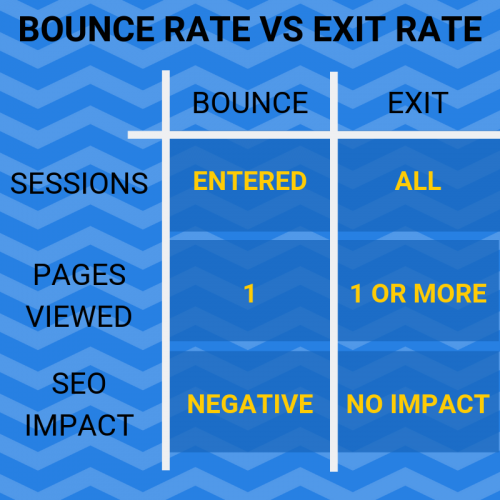
They are Calculated Based on Different Sessions
For any given page, the bounce rate will be calculated based on sessions that entered on that page. But, the exit rate will be calculated based on all sessions that viewed the page.
Bounce Rate won’t be Calculated if Multiple Pages are Viewed
Bounce rate is calculated when the page the user views is the only page in the session. Exit rate is calculated any time a user exits which could be after 1 page or 10 pages.
All Bounces are Exits
Bounce rate indicates a user visited one page of the site, then left. Not all users will bounce. But, all users will eventually exit.
Bounce Rate and Exit Rate Do Not Affect Each Other
These metrics may seem similar when you first hear about them but they are not related to each other. A page with a high % exit could have a low bounce rate.
It’s very possible that a page at the end of your funnel could have a high % exit because people aren’t ready to commit. But, it’s unlikely many users would enter the site that far in the funnel so that page would have a lower bounce rate.
Is Bounce Rate or Exit Rate More Important?
Both of these metrics are important. They work together to give you a better picture of where you are losing people on your website.
Depending on the page and the question you are trying to answer one can be more important to you at the time. But, it’s contextual. It’s not beneficial to try and rank them in general.
How Do They Impact SEO?
Bounce rate can have a negative impact on search engine rankings. Exit rate has no impact, positive or negative.
When a user visits your website from a search engine result, then goes right back to the search and clicks on another listing this is called pogo-sticking. This is what causes bounce rate to have a negative impact on your SEO.
If a user views your website then leaves right away to view another result that means your website wasn’t a good fit for the query. If this happens enough times, Google will adjust the results so the pages that users are spending more time on are increasing in rank.
To be clear, Google doesn’t use your Google Analytics data to determine ranking. Whether you have Google Analytics installed or not on your website will not directly impact your search rankings. The bounce rate metric is just the best way for you to identify if people are finding what they are looking for on your landing page and website in general. It is the best metric for you to measure pogo-sticking.
How to View the Metrics in Google Analytics
Viewing Bounce Rate
To view the overall bounce rate for your site go to Audience > Overview. You’ll see several metrics listed on that page. Towards the bottom you’ll see the bounce rate metric.
You can also view the bounce rates of individual pages.
To view the bounce rate by page go to Behavior > Site Content > All Pages. You will see there is a bounce rate column on that chart so you can see the overall bounce rate at the top and then view the metric by page.
Viewing Exit Rate (% Exit)
To view the exit rate navigate to Behavior > Site Content > All Pages. The column that says % Exit will show you the exit rate by page.
How Can You Improve These Metrics?
So, now you know what the bounce rates and exit rates are. You’ve reviewed the data for your pages in Google Analytics. But, how can you improve these metrics?
How to Reduce Exit Rate
Add Internal Links
Add text links in your articles that link to other pages on your website. This encourages readers to stay on the site by viewing more relevant articles.
Have External Links Open in New Tab
Don’t confuse users by sending them to a different website. There’s nothing wrong with adding external links but have them open in a new tab. That way, when they close the new website they don’t mistakenly close your website as well.
To make a link open in a new tab add target="_blank" in the anchor tag. Here is an example:
Adding internal links and making external links open in a new tab will help reduce bounce rate as well as exit rates.
Optimize for Mobile
Make sure your website is optimized for the device your audience wants to view it on. This means, make sure your website is mobile friendly.
The menu system should be usable on a mobile device and buttons should be large enough to click with a finger.
Also, make sure your call-to-action is obvious both on a mobile screen and desktop screen.
Improve Pagespeed
No one wants to wait for your website to load. A slow website is a great way to get a user to bounce and go back to the search results to find a faster website.
Do you have pop-up ads or videos that automatically start playing when a user visits your website? Try removing them. Run a split test to see how it impacts your bounce rate.
Popping up an ad immediately when a user lands on your website is a good way to get a user to bounce. Instead, try popping the ad up after the user has been on the page for a certain length of time or when they go to exit the page.
If you have a video play automatically make sure the sound doesn’t start. This can be a jarring experience. Since the user isn’t expecting it, their instinct is to press the back button.
Add an Event if Your Website Benefits from a Bounce
There are some instances where a bounce is a good thing.
Some pages intentionally include no internal links so the user is more likely to fill out a lead gen form. The goal of the site is for the user to visit that page and that page only, and fill out the form.
In that case, you’ll want to add an event so you are capturing the form submit. You can indicate that the event should count as an interaction so users that take that action won’t be counted in the bounce rate metric.
What is a Good Bounce Rate?
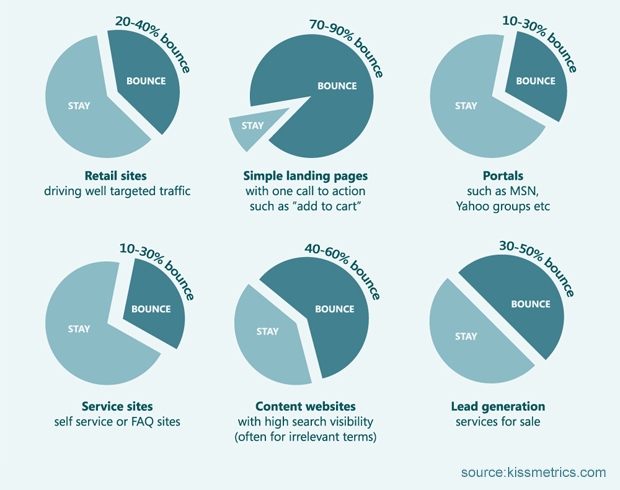
Bounce rates vary greatly by industry and your targeted audience. The best way to determine if your bounce rate is good is to compare it to your historical bounce rate.
You can compare date ranges in Google Analytics. I’d recommend comparing it to the previous year to rule out any seasonality trends.
If your bounce rate is lower than it was last year, that’s good.
If you want to get an idea of average bounce rates by industry you can review the chart below:
Do you have any tips to improve bounce rate or exit rates? Please share them in the comments!
Before we start talking about tracking events in Google Analytics, let’s take a step back and first discuss what an event is.
An event is a custom tag that can be added to elements on your website to track user behavior details in Google Analytics. Some of the behaviors you can track with an event are:
Downloading a PDF
Playing a video
Clicking an outbound link
Submitting a form
Clicking a social share button
Clicking a click-to-call phone number
Adding events allows you to get a clear picture of the interactions that matter most to you.
Events are used to track custom behaviors on your website. If instead, you’re looking to track custom acquisition sources look into UTM tags.
This information is all specific to the Universal Analytics version of Google Analytics. There is now a newer version, GA4. And in GA4 they completely changed how events work. Literally everything in GA4 is tracked with events and there are a few different types of events. You can view more information about GA4 events in the article that outlines the differences in GA4.
Step 1: Make sure you have Google Analytics set up
The first step to implement Google Analytics events, is to configure Google Analytics on your website. Once you’ve done that you’ll be ready to tackle the events.
Step 2: Configure Events
Before we dig into the technical details on how to configure an event, let’s first discuss the components of an event. An event can include a category, action, label, and value.
Category
The category is the parent group you would like to classify the event in. Some examples of common categories would be Videos, Outbound Links, and Downloads.
Action
The action is the type of interaction the user took to trigger the event. Some examples of common actions would be click and play.
Label
The label is the specific identifier for the event. This is an optional field but I would recommend using it whenever possible. This field will help identify the unique campaign used to trigger the event. An example of a label would be Spring 2019 Email Newsletter.
Value
The value is the numeric value associated with the event. This is another optional field. This doesn’t always apply but is worth using when you are able to associate a number value with the event.
Non-Interaction (True or False)
You can choose how you want an event to affect bounce rate. By default, this value is false meaning that the event does count as an interaction. When it is an interaction, if the user lands on the page, clicks a button with an event, and then immediately leaves the site that will not be counted as a bounce because that user interacted. However, if you set non-interaction to true that same experience would be counted as a bounce and your bounce rate would increase.
You can configure your events either by using Google Tag Manager, or setting them up manually. I would recommend using the same method you used to configure Google Analytics.
To Configure Events with Google Tag Manager
Confirm the variables you need are enabled
Click Variables and then under Built-In Variables click Configure. Ensure that Event is clicked under the Utilities menu. Then, click the variables you’d like to track.
The variables you want to enable will vary depending on what you want to track. Try to enable only what you need.
Here are some of the most common variables you’d want to use:
Clicks
Click Classes
This will allow you to track click events based on the CSS class. (We’ll go over how to identify a class later in the article.) This is useful to track elements where a group of items you want to track all include the same class such as downloading PDF resources.
Click ID
This will allow you to track click events based on the CSS ID. (We’ll go over how to identify an ID later in the article.) This is useful to track unique elements such as clicking a social share button or click-to-call link.
Click URL
This will allow you to track events based on the URL. This can be helpful to track outbound links.
Forms
Form Classes
This will allow you to track forms based on the CSS class.
Form ID
This will allow you to track forms based on the CSS ID.
Scroll
If you want to track scroll depth as an event enable all of the scroll variables. Scroll depth will allow you to track how far a user scrolls up or down the page either based on pixels or a percentage.
Videos
If you want to track videos you’ll want to enable all of these variables.
Create a new tag
Go to Tags and click New.
Click in the Tag Configuration box to edit.
Select Google Analytics – Universal Analytics.
Under Track Type select Event.
Then you enter in your category, action, label, and value. For each of these you can either enter in a static value or you can click the icon on the right of the field to enter in a variable.
Choose if you want Non-Interaction Hit to be True or False. If it is false then the event will affect your bounce rate. If it is true than the event will not count as an interaction and therefore will not have an effect on your bounce rate. Leaving this at false is most common.
Under Google Analytics Settings select your Google Analytics tracking variable.
Next, click in the Triggering box to edit. This is where you’ll identify how to target the element you want to target as your event.
If you’ve already created your trigger select it from the list. Otherwise, click the ‘+’ icon in the top right to create a new trigger.
When creating a new trigger, click in the Trigger Configuration box to edit.
Select how you want to trigger your event. You will most likely want to use a trigger under Click or User Engagement.
To track a click event select Click – All Elements.
Then select Some Clicks under This trigger fires on.
Then choose the variable you want to use to identify your target such as Click Classes or Click ID.
Save and name your trigger.
Save and name your tag.
Not sure how to find a CSS class or ID on your website to use in the trigger?
You can find this information out by viewing your website in the chrome browser.
Navigate to the element you want to track on your website in the Google Chrome browser.
Right click on the element and click Inspect.
This jumps you to the part of the website code that controls that particular element. Look at the highlighted code. If the element has a class you will see class="ClassName". If it has an ID you will see id="IDname". The name in quotes is what you’ll use for your trigger (ClassName or IDname in this example).
Publish your new tag
Now all you have to do is publish your changes to your website.
Click the Submit button in the top right.
Name your version and add a short description if you’d like.
Then, click Publish to set your changes live.
Manually Setting up Google Analytics Events
Adding an onclick event
If you want to add a Google Analytics event directly to a hyperlink anchor tag you’ll want to add it as an onclick event. A hyperlink anchor tag looks like this: <a href="link">link here</a>.
To add a Google Analytics event to the link you can add an onclick event.
If this was your original link:
<a href="link">link here</a>
This is what it would look like with the onclick event:
To know how to add the event details to your onclick event you’ll need to know if you’re using Google Analytics Classic, Universal, or the gtag.js tracking code. The code varies slightly for each.
How do I know which version of the Google Analytics tracking code is on my website?
To find out which version of Google Analytics tracking you’re using:
Go to your website.
Right click and select View page source.
Press ctrl (cmd) + F to open the find menu.
Search for the various tags.
Search for ga.js. If you find a reference to this you are using the Classic tracking.
Search for analytics.js. If you find a reference to this you are using Universal tracking.
Search for gtag.js. If you find a reference to this you are using the gtag.js tracking code.
How to add a manual event when you can’t edit the hyperlink
If you can’t edit the link to add an onclick event, you can target the link using jQuery. jQuery is a javascript library designed to simplify implementation.
Using jQuery, you can add an event listener to add a Google Analytics event. This is more complicated but it works great when you can’t directly edit the link.
Unless you’re already familiar with jQuery or javascript I wouldn’t recommend this route. Instead, I would recommend installing Google Tag Manager and set your events up that way.
Google Tag Manager provides several ways to target a link (by CSS class, CSS ID, URL, or even link text) and will make both implementation and maintenance much easier.
Best Practices for Google Analytics Events
Use a Consistent Naming Convention
To make the most use out of your event data make sure you use a consistent naming convention. If you want to be able to easily compare the performance of various campaigns under the same category then make sure that category has the same name for each campaign (label).
This means use the same spacing and capitalization too. Any change will display as an additional row in Google Analytics instead of grouping the data together.
Create a Spreadsheet for Multiple Contributors
If you plan to have multiple people creating events (or even if you just want to make it easier on yourself) create a spreadsheet. Keep track of your category names and actions.
With documentation in place all you have to do is copy and paste when you want to create a new campaign in an existing category. This will help avoid duplicate categories due to type-os, plural, or capitalization issues.
Navigate to Admin and then click Goals under View.
Click on New Goal.
Name your goal.
Under Type select Event.
Click Continue.
Add the conditions that meet your requirements. You can specify all parameters (category, action, and label) or you can just choose to trigger your goal based on one.
Click Save and your new goal is ready.
Step 4: Testing
Use Real-Time Reports to Test Your New Event (and Goal)
Once everything is configured, test your work and make sure everything reports how you expect.
The best way to test events and goals is to use the real-time reports. Navigate to Real-Time to view the data in Google Analytics. Then, click on Events to test your events or Conversions to test your goals.
The view defaults to Active Users. To make it easier to view your various tests click Events (Last 30 min) or Goal Hits (Last 30 min).
Now, test by going to your website and clicking on the element you have set up to trigger the goal or event.
If you have your internal IP filtered out your data won’t be tracked in Google Analytics. To ensure your test isn’t being blocked by anything I test on a mobile device. Make sure your WiFi is turned off so you are using data and not on your standard IP address.
If everything is configured correctly you should see the event or goal trigger in your real-time reports.
Step 5: Viewing Data in Google Analytics
Of course, all of this effort will be wasted if you don’t review the data in Google Analytics.
To review your event data navigate to Behavior > Events. Both the Overview and Top Events reports provide great insight into event performance.
On the Top Events report you can easily toggle between category, action, and label as the primary dimension.
To review your goal data navigate to Conversions > Goals > Overview. This report provides insight into your goal performance.
Remember to review this data. Tracking the data is great, but it’s pointless if you never review it.
Are you tracking events in Google Analytics? Do you have any implementation tips or best practices? Share them in the comments!
So, you have a website and you already have Google Analytics setup and tracking your data. That’s a great start! But, you want to start tracking more. You want to find out who clicks what on your site and which elements are critical in the conversion process. You’d like to determine which campaigns are performing the best and sending qualified traffic to your site.
You can and certainly should do all of this. To accomplish this, you would use a combination of UTM tags and event tracking. It’s important to understand the difference between these tracking methods so you don’t override any data erroneously.
The first thing you need to understand is that UTM tags are used to track external links and events are used to track internal links. UTM tags are intended to track acquisitions from your campaigns; whereas, events are meant to track elements within your web property. This becomes apparent when you review your data. In Google Analytics, the data from UTM tags will appear in the Campaigns section which is under Acquisition. While Events appear under Behavior. And in Google Analytics 4 (GA4), UTM tags appear in the Acquisition reports and Events appear under Engagement.
UTM Tags are Used for External Sources
Only use UTM tags on external links. Don’t use UTM tags on internal links that go from one page of your website, to another page on the same website. Adding UTM tags to internal links will override the original referrer source and medium. So, if a user got to your website from the source of Google, and then clicked on an internal link with a UTM tag that included a source of YourSite; Google Analytics would override the original referral source of Google, with the new referral source of YourSite.
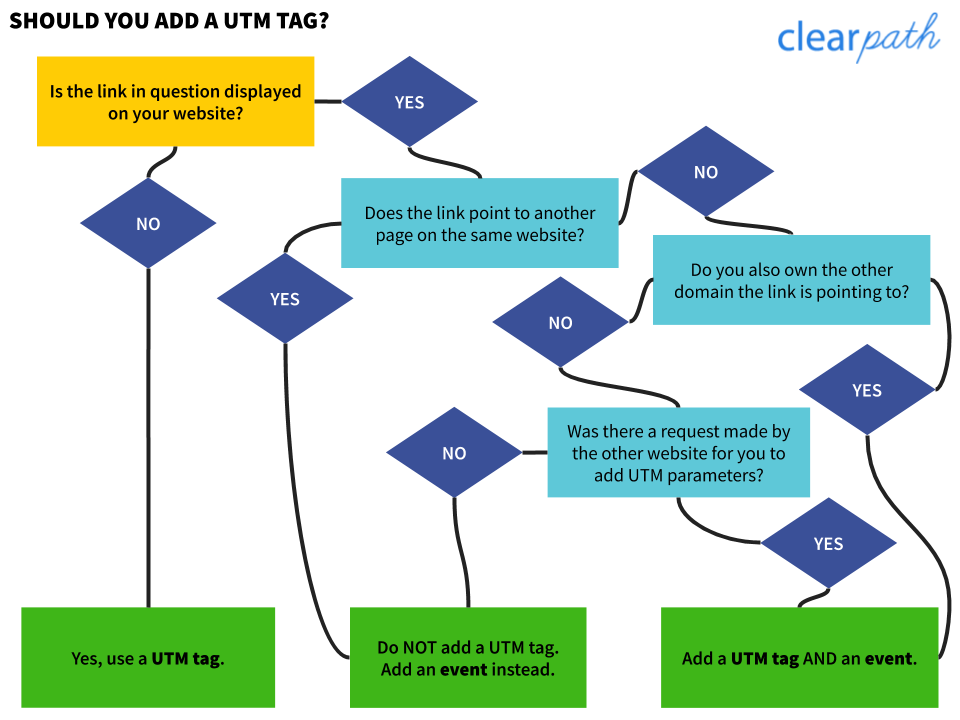
Does this mean you would never use a UTM tag on your website? No, you can use a UTM tag on a link on your website if it links to a different website. If it goes to a different website then it is an external link. You should know though, that this would not actually provide any Google Analytics data for you, unless you also own the other domain. To capture clicks on the link and collect data on the original website, you could add an event. If the site you’re referring to also needs to track this information you can still include the UTM tag. If the link on your website is an external link you can track it by using both a UTM tag and an event. The event will track the click under Behavior on your site, and the UTM tag will track the click under Acquisition on the site you sent the traffic to.
It can get confusing to understand when and if you should add a UTM tag to a link on your own website. To help understand when it’s appropriate, refer to the flowchart below.
Use UTM Tags to Track Campaign Efforts
UTM tags are a terrific way to track campaign performance. Tracking marketing campaigns across various networks is what UTM tags should be used for. You can add UTM tags to links in e-mail campaigns, social media posts, and paid ads.
When you add a UTM tag, you’ll be adding more details to your Google Analytics data. You’ll be able to see campaign performance metrics that would not be available otherwise. This will help you determine which marketing efforts are having an impact.
How Do UTM Tags Work?
UTM tags work by appending parameters to your URL to identify the source, medium, and campaign. Google provides a Campaign URL Builder that makes it easy to add UTM tags to your URL. If you want to know which parameters to add and why, and how to keep your data clean and tidy, view our guide on how to create a UTM code.
Events are Used for Internal Tracking
If you want to track internal links on your website or track an interaction someone is taking while they are navigating your website, that is when you want to leverage events in Google Analytics.
You can add an event to links or buttons. So, you can capture external site referrals, form submissions, downloads, video plays, and just about any other interaction on your website. And, when you add an event interaction it’s easy to associate an event with a goal in Google Analytics.
This allows us to stay on top of the interactions that play a key role on our website. If you have a podcast, you can add an event to the podcast play button on embedded players on your website. Then, you can add podcast plays as a goal for your website. If you have a YouTube channel, you can add an event to the video play button on embedded YouTube videos. Then, you can add a goal for video plays. If you are an affiliate marketer, you can track your outbound referral clicks with an event and set up referral clicks as a goal.
What this does is allow us to get more visibility into our website visitors and leverage our Google Analytics data to it’s full potential. This makes it easier to make informed decisions so we know what to improve and what efforts we should prioritize.
How Do Events Work?
There are a few different ways you can add events to elements on your website. You can add them using Google Tag Manager. You can also add them manually. If you would like step-by-step directions on how to add events you can view our complete guide on how to track events in Google Analytics.
Does this Apply to GA4
Yes, even though events play a larger role in Google Analytics 4 than in Universal Analytics, the difference between UTM tags and events still functions the same. UTM tags still provide data in GA4 and all of the rules we discussed in this article apply both to GA4 and Universal Analytics.
UTM Tags vs Events
So, in conclusion, UTM tags should be used to track campaign performance from sources outside of your website, and events should be used to better understand interactions on your website. UTM tags help to better track acquisition sources, whereas events help to better track user behavior.
How do you use UTM tags and event tracking? Feel free to share any of the tips or tricks you’ve learned to get the most value out of these items.
Do you want to listen to this article? Here’s the podcast episode:
Multitasking lowers productivity by 40%! Batch tasks for efficiency, especially in blogging. Boost productivity with our step-by-step guide to batch your blog content creation.Read More