Tracking your website data with Google Analytics is a must. But, it will do you no good if you don’t understand the metrics. Knowing where people leave your site is a good place to start. So, let’s discuss bounce rate vs exit rate.
Google defines bounce rate as:
The percentage of single-page sessions in which there was no interaction with the page.
Bounces are sessions where a user visits your website and then leaves. They don’t interact or continue. Instead they close the window, type a new URL in the browser address bar, or click the back button.
Google defines exit rate (% exit) as:
The (number of exits) / (number of pageviews) for the page or set of pages. It indicates how often users exit from that page or set of pages when they view the page(s).
So, what that means is bounce rate is the percentage of people who visited the page and immediately left. Whereas, exit rate is the percentage of all exits from that page.
They are Calculated Based on Different Sessions
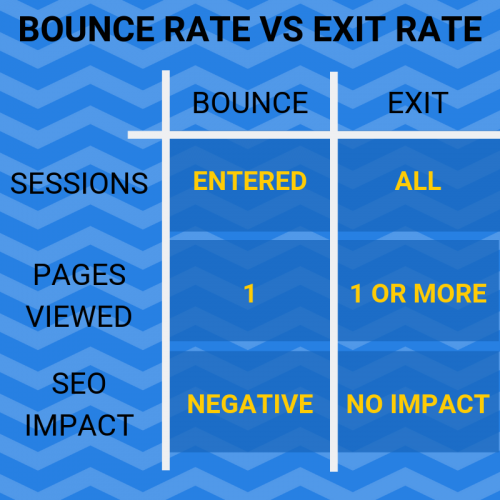
For any given page, the bounce rate will be calculated based on sessions that entered on that page. But, the exit rate will be calculated based on all sessions that viewed the page.
Bounce Rate won’t be Calculated if Multiple Pages are Viewed
Bounce rate is calculated when the page the user views is the only page in the session. Exit rate is calculated any time a user exits which could be after 1 page or 10 pages.
All Bounces are Exits
Bounce rate indicates a user visited one page of the site, then left. Not all users will bounce. But, all users will eventually exit.

Bounce Rate and Exit Rate Do Not Affect Each Other
These metrics may seem similar when you first hear about them but they are not related to each other. A page with a high % exit could have a low bounce rate.
It’s very possible that a page at the end of your funnel could have a high % exit because people aren’t ready to commit. But, it’s unlikely many users would enter the site that far in the funnel so that page would have a lower bounce rate.
Is Bounce Rate or Exit Rate More Important?
Both of these metrics are important. They work together to give you a better picture of where you are losing people on your website.
Depending on the page and the question you are trying to answer one can be more important to you at the time. But, it’s contextual. It’s not beneficial to try and rank them in general.
How Do They Impact SEO?
Bounce rate can have a negative impact on search engine rankings. Exit rate has no impact, positive or negative.
When a user visits your website from a search engine result, then goes right back to the search and clicks on another listing this is called pogo-sticking. This is what causes bounce rate to have a negative impact on your SEO.

If a user views your website then leaves right away to view another result that means your website wasn’t a good fit for the query. If this happens enough times, Google will adjust the results so the pages that users are spending more time on are increasing in rank.
To be clear, Google doesn’t use your Google Analytics data to determine ranking. Whether you have Google Analytics installed or not on your website will not directly impact your search rankings. The bounce rate metric is just the best way for you to identify if people are finding what they are looking for on your landing page and website in general. It is the best metric for you to measure pogo-sticking.
How to View the Metrics in Google Analytics
Viewing Bounce Rate
To view the overall bounce rate for your site go to Audience > Overview. You’ll see several metrics listed on that page. Towards the bottom you’ll see the bounce rate metric.
You can also view the bounce rates of individual pages.
To view the bounce rate by page go to Behavior > Site Content > All Pages. You will see there is a bounce rate column on that chart so you can see the overall bounce rate at the top and then view the metric by page.
Viewing Exit Rate (% Exit)
To view the exit rate navigate to Behavior > Site Content > All Pages. The column that says % Exit will show you the exit rate by page.
How Can You Improve These Metrics?
So, now you know what the bounce rates and exit rates are. You’ve reviewed the data for your pages in Google Analytics. But, how can you improve these metrics?
How to Reduce Exit Rate
Add Internal Links
Add text links in your articles that link to other pages on your website. This encourages readers to stay on the site by viewing more relevant articles.
Have External Links Open in New Tab
Don’t confuse users by sending them to a different website. There’s nothing wrong with adding external links but have them open in a new tab. That way, when they close the new website they don’t mistakenly close your website as well.
To make a link open in a new tab add target="_blank" in the anchor tag. Here is an example:
<a href="https://example.com" target="_blank">new tab example</a>How to Reduce Bounce Rate
Follow the Tips to Reduce Exit Rate
Adding internal links and making external links open in a new tab will help reduce bounce rate as well as exit rates.
Optimize for Mobile
Make sure your website is optimized for the device your audience wants to view it on. This means, make sure your website is mobile friendly.
The menu system should be usable on a mobile device and buttons should be large enough to click with a finger.
Also, make sure your call-to-action is obvious both on a mobile screen and desktop screen.
Improve Pagespeed
No one wants to wait for your website to load. A slow website is a great way to get a user to bounce and go back to the search results to find a faster website.
You can use Google PageSpeed Insights to get an idea of what you can do to improve your pagespeed.
Remove Intrusive Ads and Audio
Do you have pop-up ads or videos that automatically start playing when a user visits your website? Try removing them. Run a split test to see how it impacts your bounce rate.
Popping up an ad immediately when a user lands on your website is a good way to get a user to bounce. Instead, try popping the ad up after the user has been on the page for a certain length of time or when they go to exit the page.
If you have a video play automatically make sure the sound doesn’t start. This can be a jarring experience. Since the user isn’t expecting it, their instinct is to press the back button.
Add an Event if Your Website Benefits from a Bounce
There are some instances where a bounce is a good thing.
Some pages intentionally include no internal links so the user is more likely to fill out a lead gen form. The goal of the site is for the user to visit that page and that page only, and fill out the form.
In that case, you’ll want to add an event so you are capturing the form submit. You can indicate that the event should count as an interaction so users that take that action won’t be counted in the bounce rate metric.
What is a Good Bounce Rate?
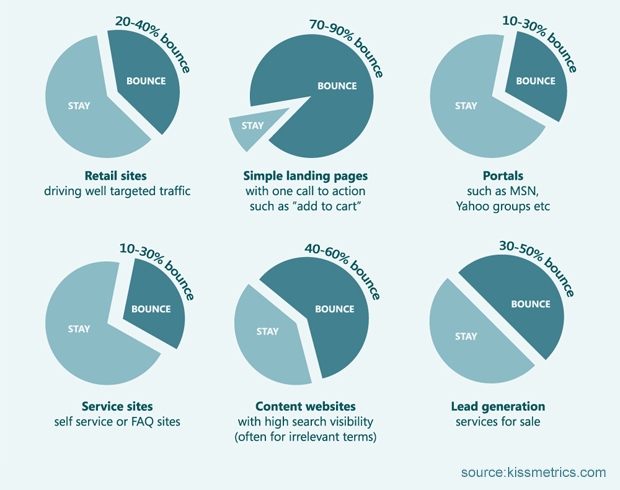
Bounce rates vary greatly by industry and your targeted audience. The best way to determine if your bounce rate is good is to compare it to your historical bounce rate.
You can compare date ranges in Google Analytics. I’d recommend comparing it to the previous year to rule out any seasonality trends.
If your bounce rate is lower than it was last year, that’s good.
If you want to get an idea of average bounce rates by industry you can review the chart below:

Do you have any tips to improve bounce rate or exit rates? Please share them in the comments!
