Collecting Google Analytics data is great, and important for all website owners. And when you first start out, sometimes simply collecting data is all you can handle without getting overwhelmed. Once a decent amount of data has been collected you need to start analyzing it in order to get a benefit. You need to make sense of the data and understand what story it’s telling in order to make improvements. An easy way to get started with analyzing your data is to focus on the Google Analytics automated insights. We’ll go over three simple ways to analyze data using automation built into Google Analytics.
Automated Insights
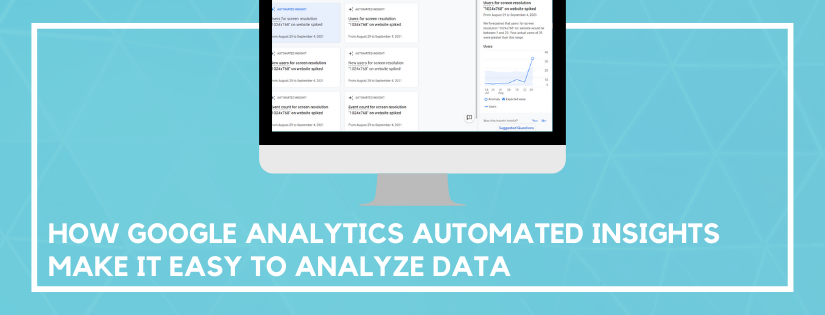
For a quick way to identify dips and peaks in your data look at automated insights. The automated insights detect unusual changes and emerging trends. The insights are listed in an easy to access menu in Google Analytics so you can at a glance review the biggest changes.
The automated insights can be found both in Universal Analytics and GA4.
- In Universal Analytics, you can find the automated insights on the Home screen and then click Insights in the top right corner.
- In GA4, scroll down to Insights on the Reports Snapshot screen. Then click View all insights.
Custom Insights
To get even more value out of the automated insights, you can create custom insights. Custom insights allow you to monitor the metrics that are most important to your business. When they trigger you can even be notified via email or text message.
Custom insights can be created in either version of Google Analytics.
- In Universal Analytics, click on Customization and then Custom Alerts.
- In GA4, once you click View all insights you can click Create in the top right corner to create a custom insight.
Ask Any Question
If you have a question about your data and it hasn’t triggered an automated or custom insight, that’s no problem. At the top of Google Analytics you can type in any question you have. You use plain English to create a question, and then it directs you to the data.
Some of the questions you can ask are:
- On what days do I get the most users?
- What devices are used the most?
- How many users from organic search in the last 30 days?
- What are my top products by revenue?
- What’s my average page load time?
In GA4 you can even click on the insight icon in the top right of any of the overview dashboards. That pulls up a list of questions you can click on and immediately get the answer.
When you ask a question you’ll be able to jump right to the report with the data. This not only makes it easy to navigate the system when you are unfamiliar with the reports, it also puts you in the right mindset. Whether you’ve been using Google Analytics for years or you’re new to it, you should always have a question in mind that you are trying to answer with data.
In Summary
Collecting data is great, but you will get to a point when you need to figure out how to analyze it. These three automated features make it super simple to make sense of your data. The insight is there, take the time to review it so you can make data-driven decisions.
Do you want to listen to this article? Here’s the podcast episode:
