Collecting Google Analytics data is great, and important for all website owners. And when you first start out, sometimes simply collecting data is all you can handle without getting overwhelmed. Once a decent amount of data has been collected you need to start analyzing it in order to get a benefit. You need to make sense of the data and understand what story it’s telling in order to make improvements. An easy way to get started with analyzing your data is to focus on the Google Analytics automated insights. We’ll go over three simple ways to analyze data using automation built into Google Analytics.
Automated Insights
For a quick way to identify dips and peaks in your data look at automated insights. The automated insights detect unusual changes and emerging trends. The insights are listed in an easy to access menu in Google Analytics so you can at a glance review the biggest changes.
The automated insights can be found both in Universal Analytics and GA4.
In Universal Analytics, you can find the automated insights on the Home screen and then click Insights in the top right corner.
In GA4, scroll down to Insights on the Reports Snapshot screen. Then click View all insights.
Custom Insights
To get even more value out of the automated insights, you can create custom insights. Custom insights allow you to monitor the metrics that are most important to your business. When they trigger you can even be notified via email or text message.
Custom insights can be created in either version of Google Analytics.
In Universal Analytics, click on Customization and then Custom Alerts.
In GA4, once you click View all insights you can click Create in the top right corner to create a custom insight.
Ask Any Question
If you have a question about your data and it hasn’t triggered an automated or custom insight, that’s no problem. At the top of Google Analytics you can type in any question you have. You use plain English to create a question, and then it directs you to the data.
Some of the questions you can ask are:
On what days do I get the most users?
What devices are used the most?
How many users from organic search in the last 30 days?
What are my top products by revenue?
What’s my average page load time?
In GA4 you can even click on the insight icon in the top right of any of the overview dashboards. That pulls up a list of questions you can click on and immediately get the answer.
When you ask a question you’ll be able to jump right to the report with the data. This not only makes it easy to navigate the system when you are unfamiliar with the reports, it also puts you in the right mindset. Whether you’ve been using Google Analytics for years or you’re new to it, you should always have a question in mind that you are trying to answer with data.
In Summary
Collecting data is great, but you will get to a point when you need to figure out how to analyze it. These three automated features make it super simple to make sense of your data. The insight is there, take the time to review it so you can make data-driven decisions.
Do you want to listen to this article? Here’s the podcast episode:
What role does Quora play in digital marketing? Can Quora help with Search Engine Optimization (SEO)? Here are three ways how Quora can benefit your site.
What is Quora?
First, let’s go over what Quora is. Quora is a question and answer website. There are countless topics. Any question can be asked and anyone can answer it. Answers can be upvoted and downvoted so when you look at a question ideally the best answer is at the top.
3 Ways Quora Helps Your Website
Referrals
Quora can be a good source of referrals for your website. Quora ranks well in search engines. It has a global Alexa rank of 380 which means it is a popular site and there’s a good chance it outranks your blog.
When you answer a question on Quora you can add a link. That link will be a no follow link. That means, it won’t directly impact SEO as a backlink. It will however be a source of referrals.
Quora ranks well in search engines. If someone searches in Google for a question related to your business a Quora result may appear. If you’ve provided an answer and included a link to a specific page on your website (since the question is relevant to your business) there is a chance that person will click through to your website.
So, the benefit of links on Quora isn’t to increase the number of backlinks to your website. The benefit of links on Quora is to help your target audience find the content on your website that can help them during the research stage.
Content Ideas
Another benefit of Quora is the understanding of the main questions and concerns that your target audience has. When you review and answer Quora questions on a regular basis you begin to become familiar with the common questions. If you already have content on your website that addresses these questions, great! Chances are though, you will find topics that keep coming up that you can answer but you don’t have a relevant link on your website to link out to.
This is a great way to identify content gaps on your website. Create an article that addresses the exact problem. This not only adds more content to your website, it also gives you another page you can link to when you are answering these questions.
Customer Service
Once your brand grows to the point where you have a following, you will start to find questions about your product directly on Quora. Use Quora for customer service. Take the opportunity to answer the questions yourself instead of letting the public respond.
Before your brand gets to that point, you can still use it for customer service by responding to general inquiries about your product or industry. When the question is not asking about your exact product it doesn’t hurt to include some competitors as well if that is the best way to answer the question. It’s important to always answer the question as completely as possible and don’t get too distracted trying to make it about your business. Think of the original poster’s concern first.
In Summary
Using Quora on a regular basis can benefit your website. Even though the links are no follow links they are still worth having. The links can increase your website referrals, you can gain content ideas through question insight, and you can even help stay on top of customer service concerns.
Do you want to listen to this article? Here’s the podcast episode:
Getting natural backlinks to your website is one of the most difficult parts of Search Engine Optimization (SEO). And many consider backlinks to be a strong ranking factor. There is a tool called Help a Reporter Out (HARO) that can help streamline this process. Let’s dig into how to get HARO backlinks to improve SEO.
What is HARO?
Let’s start by discussing what HARO is. HARO is an acronym for Help a Reporter Out. It is a tool that makes it easy for “sources” (such as website owners and bloggers) to connect with reporters. When a journalist is writing a story they can use HARO to find quotes and information to add to their article. If the author uses your content in the article, they generally include a backlink to your website.
The reporters that use HARO to find sources range greatly. Sometimes it specifies what company they are with. Many times it just says anonymous. The anonymous leads are usually the larger publications. HARO is a good way to get backlinks on popular sites that otherwise would be impossible to get.
Register as a Source
To use HARO, you first need to register as a source. By signing up as a source you’ll start to receive emails three times a day with leads. And, you’ll be able to respond to the leads using the email address you registered with. Registration is free and required.
Understand What You Want to Be Known For
Before you can start using HARO, you need to have a clear understanding about what you want to be known for. There will likely be several leads that you can respond to. But, you want to stay focused on the relevant leads that are worth your time. You want to focus on leads that relate to your target audience.
Spend the time to create a persona and understand the exact person you want to reach. That will save you a lot of time when going through HARO leads. When you understand who you’re talking to and what you want to be known for you can easily scan the leads to find any relevant requests. There are several leads so understanding what you’re looking for will save you time both in reviewing the emails and writing responses.
The goal is to end up on websites where your target audience hangs out. The best way to do that is to submit pitches to relevant topics. Focus on quality over quantity.
Review Leads Daily
To be successful with HARO, you need to review the lead emails daily. All leads have a due date. There is a date and time that the information needs to be submitted by. Sometimes the cutoff is in a few hours, sometimes it’s in a month. Either way, your best bet is to pay attention and submit your response as fast as possible.
Use Gmail Filters to Highlight Top Leads
The number of requests in each email can get overwhelming. It’s a lot to hunt through. To streamline the process I like to use a couple of filters in Gmail.
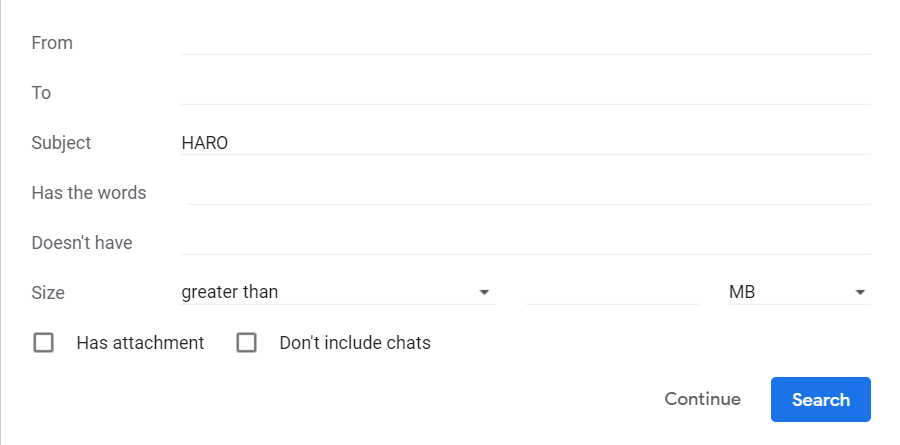
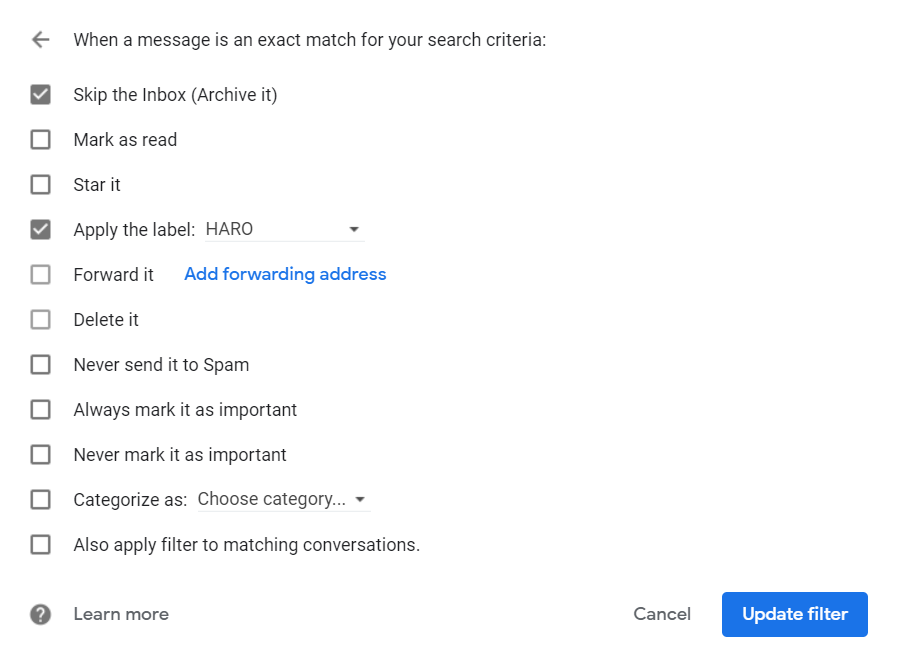
First, I create a filter to apply a label to all of my HARO emails. Then, I have those emails skip the inbox and immediately archive within that label. That way, my inbox doesn’t get cluttered with HARO messages and I can reserve time to go through all of them at once.
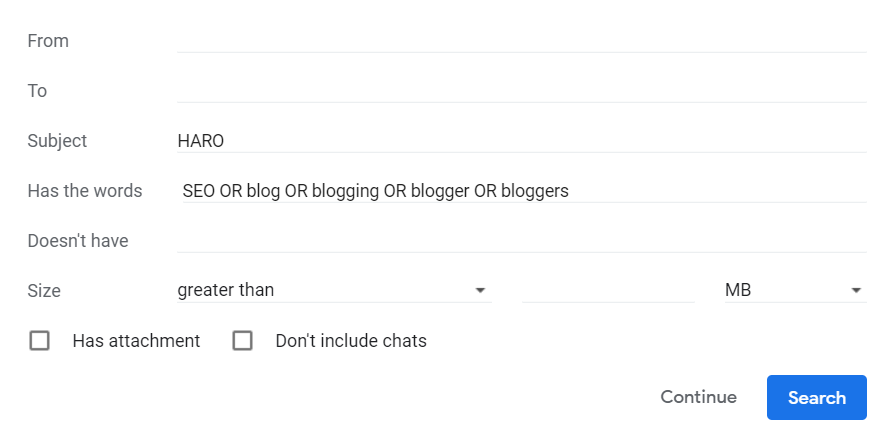
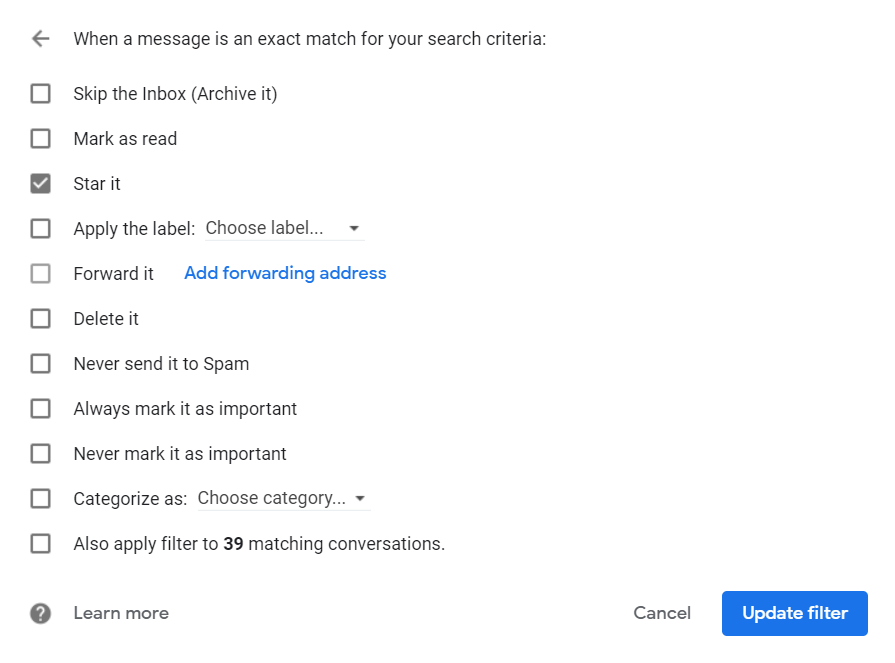
I also have a filter to add a star to the HARO emails that include keywords that I’m interested in.
This makes it easy for me to get into a routine to work on HARO responses. I go to my HARO label to see all of my unread leads. Then, I can see the emails that are the most important because they are starred. (Remember the star was applied from my filter when one of my keywords was found within the email.)
I start by reviewing the starred emails and respond to any (not expired) leads that are related to what I want to be known for. Then, I scan through the other emails to make sure there are no other leads I should respond to.
The emails are separated by categories. To save time only read through the categories that are related to your field. So, if you are a travel blogger you can skip the Biotech and Healthcare section and focus on the Travel or maybe even Lifestyle and Fitness section.
Follow Directions and Send Unique Response
When you find a lead you want to respond to, make sure you read the entire prompt. Follow any directions from the author. Spend the time to answer the complete prompt while also remaining concise. And even if the response is similar to another pitch you’ve sent, don’t copy and paste your response. Write a unique response. Don’t try sending canned responses. Make sure your response feels like a genuine high-quality response so it can beat out all the other responses.
In Summary
Getting HARO backlinks requires a routine. This needs to be done on an ongoing basis to continue to grow backlinks. For the most SEO benefit, you want steady backlink growth. Not a bunch at once and then no more. Not every HARO response will result in a backlink. In my experience about 15-20% of pitches get published. So, don’t stress about the outcome. Instead, get into a habit of checking HARO leads and responding to the best matches. Over time this will build natural backlinks on relevant sites.
Do you want to listen to this article? Here’s the podcast episode:
One of the most challenging parts about blogging is being consistent. And consistency happens to be an important piece. One of the best ways to tackle this is to create a blog content calendar. We’ll go over everything you need to know to create a content calendar for your blog.
What is a Content Calendar?
Before we can discuss creating a content calendar, we need to understand what it is. A content calendar organizes your content ideas and assigns them to publish dates. The specific medium used to create the calendar can vary. It can be a spreadsheet, post-it notes, or even an actual calendar. It is a system that allows you to organize your content ideas based on when they will be published.
Why have a Content Calendar?
The content calendar helps you create a plan. It makes it easy to understand what to work on to stay on track. It helps hold you accountable.
Instead of a list of random ideas, the content calendar has a specific timeline. You have committed the content ideas to publish dates. Of course, it’s easy enough to make edits and change the schedule. But, it is easier to be consistent when you already have a plan. Content calendars allow you to commit to deadlines and plan ahead.
How to Create a Content Calendar
Step 1: Determine Posting Frequency
You’ll need to determine a posting frequency. Ideally, you’ll want to post weekly content. The most important part about your posting frequency is to be consistent while focusing on quality over quantity. So, if your schedule doesn’t accommodate weekly high-quality content updates, then aim for a schedule that gives you more time. You can post every other week or monthly instead. The more posts you’re able to create, the faster you’ll see your search engine traffic grow.
Step 2: Create a Spreadsheet
My go-to tool to create a content calendar is Google Sheets. Creating a spreadsheet is simple and gives lots of flexibility.
To get started with a content calendar, you can download the free Google Sheets template below.
To create your content calendar list out your post schedule dates based on your posting frequency. If you plan to post weekly, you’ll add a date for each weekday you plan to publish a new post. Then, in another column, document the article topic that will be posted that day.
You can also add any columns you’d like to carry over metrics you found during the keyword research stage. If you use the template above the metrics will automatically appear on the calendar tab when you select the topic using the dropdown list.
Step 3: Plan out Next Quarter
Assign topic ideas to every day you want to publish a post for the next quarter. So, roughly three months. If you have more ideas, do the full year. Keeping blogs current takes time. Get the keyword research out of the way so you have a full calendar ahead of you. That way, when you have blog time you can focus on writing and batching your posts instead of figuring out what to write next.
In Summary
A content calendar helps you stay organized. If you commit your content ideas to dates, it will be easier to blog consistently. Having a plan will help keep you moving in the right direction and make it that much easier to push forward.
Do you want to listen to this article? Here’s the podcast episode:
Split tests are fun. They allow you to test your assumptions and make changes that you can be sure make sense for your audience. A split test is when you have two variations of a page on your site (or the entire site) running at the same time. You send half of your traffic to one version, then the other half to the other version. A split test tool tracks results and shows which variation produced more conversions. But, how much traffic do you need to run a split test? We’ll go over the details you need so you know when you’re ready to get started with split testing.
Any amount of traffic is technically enough. Split test tools don’t have limitations. The problem is, with few visitors it can take too long to get a statistical significance. For the results to be statistically significant, you want the results to be at least 90% confident. (And 95% would be even better.) What a confidence level of 90% means, is the declared winner will be the winner 90% of the time.
You also want the test to last no longer than 4-6 weeks. After that time people start to delete cookies and results begin to deteriorate. So, there is a certain amount of traffic required to have a large enough sample size to hit a statistical significance on time.
At a minimum, you want to have 500 conversions per month before you start running split tests. Some people say 500 conversions per week, or 5000 visitors per week. But, if you have 500 conversions per month you should have enough data to get started.
The more variations you test simultaneously, the more traffic you’ll need. So, if you have 500 conversions per month, that’s roughly 250 for each variation. If you want to run more than the original and one variation, you’ll need more conversions.
How to Run Split Tests with Less Traffic
Test Micro Conversions Instead of Macro
If your primary conversion point (macro conversion) doesn’t have enough conversions to run a split test, try a smaller (micro) conversion. So, instead of split testing your payment funnel, try split testing your lead magnet. Having people sign up for your newsletter may not be your end goal. But, if it’s getting more conversions that may be a good goal to try and improve with a split test. Improving that stage could have a trickle down effect and increase conversions lower in the funnel as well. So, you can get closer to the conversions needed to split test your primary conversion point.
Test Radical Changes
If you have low traffic and few conversions, don’t split test small changes. Skip testing button colors, button text, and headlines. Instead, make drastic changes. Completely redesign the page. It will be harder to pinpoint the exact change that improved or decreased conversions. But, since the performance change will be drastic, a conclusive result will be easier to reach.
Combine with Qualitative Data
If you have low conversions, you can combine the split test results with data from other conversion optimization tools. Surveys and qualitative data could provide insight into why the split test results look the way they do. Analyzing heatmaps of the variations could also provide insight to help solidify the results.
In Summary
Without conversions, split tests will be useless because you won’t have data to determine a winner. Once you have about 500 conversions a month, start running split tests. And while you’re getting there, it doesn’t hurt to start listing and prioritizing split test ideas.
Do you want to listen to this article? Here’s the podcast episode:
Conversion Rate Optimization (or CRO) is the act of incrementally improving your website in an attempt to increase the number of visitors that complete a desired action. One method of improving conversion rate is to send surveys to your site visitors. Then, leverage the data from survey responses to make website improvements. But how do you send surveys to site visitors and what survey questions improve CRO?
Why Ask Open Ended Questions?
Open ended questions are going to provide you with the most value. Open ended questions are when the respondent types in a response, instead of clicking pre-configured options. The reason why these provide more value is because you learn how your audience speaks. They may use terms to describe benefits in a different manner than you ever have. Update your content to reflect the same language your audience uses. Write the benefits on your homepage using the same words your visitors use to describe them.
The downside is that open ended questions are more work to analyze. To get the most value, you’ll want to read each response. Of course, looking at a graph is much faster. If at all possible, you should read each response. If that isn’t feasible, you can try to find common themes by loading the results into a word art tool. That will display the results in a word cloud. In the word cloud, the topics that come up the most will be larger so it’s easy to find trends.
Qualitative vs Quantitative
In general, surveys are qualitative data because they are subjective responses. Yet, depending on how you create the question it can be more qualitative or quantitative. Qualitative data is an observed or reported experience. Whereas quantitative data is a measurable metric.
Survey Questions to Ask
Qualitative Survey Questions
Why did you decide to make a purchase?
This can help you understand what led to the buying decision. Was there an initial problem that triggered the purchase? Did something on the website convince the person to complete the transaction? This can help you understand if purchases are due to use cases you’re already aware of, or new ones. If it’s a new use case there may be optimizations to increase the chances of that use case converting others.
If you didn’t purchase, what stopped you?
This question can help you better understand obstacles and frustrations your visitors face. Once you understand what’s stopping people from buying, you can begin improving those areas.
Were you able to complete your task? And if not, why not?
Not everyone comes to your site with a goal to purchase. They may be researching a particular question, or looking for a video or a download. Understanding what people are looking for and if they were able to find it can help you optimize your site navigation.
Quantitative Survey Question
By far, my favorite quantitative question to add to a survey is the Net Promoter Score (or NPS). To get the NPS you ask How likely are you to recommend us to a friend or a colleague? The answer is a number scale of 0-10. Ten is the highest and most likely. Zero is the lowest and extremely unlikely.
If someone answers the Net Promoter Score with a nine or a ten, that means they are a promoter. They had a good experience and they will positively promote your brand. If someone answers with a seven or eight they are passive. The experience was fine, there were no issues, but they aren’t going to go out and talk about your brand. And anyone who answers six or lower is a detractor for your brand. These people will be negative word of mouth for your brand. People are more likely to talk about bad experiences than good experiences.
Ideally you want your NPS in the nine or ten range. If the NPS is six or below you want to talk to your audience and see what you can do to improve the experience.
Survey Tools
There are a few different tools you can use to collect survey responses. You can use Google Forms or Survey Monkey to create stand-alone forms to send to people. This will work best if you already have an email list you can use to contact your audience.
You can also gather survey responses directly on your website through Hotjar and Qualaroo. This is the route I take because it’s nice to get feedback from website visitors. Sometimes people who sign up for your email list do not reflect the same people who visit your site. You want to hear from the people who don’t stay and don’t convert as well as the people who do.
Do you want to listen to this article? Here’s the podcast episode:
One of the best ways to improve your website conversion rate is to observe your site visitors. And one of the easiest ways to do this is with website session recordings. Now, reviewing session recordings can get time consuming. To save time, here’s what to look for and what you can learn from session recordings to make an impact.
What are Website Session Recordings?
Before we get too far ahead of ourselves here, let’s back up and go over what website session recordings are. Session recordings are videos of anonymous visitors using your website. You can’t hear them. You can’t identify who they are. You are only looking at a video of your site and watching a mouse move around it. You see mouse movement, scrolling, clicks, and any pages they viewed. There are a handful of conversion rate optimization tools that you can use to collect this data.
What Can You Learn from Session Recordings?
There are four primary insights you can gain from reviewing website session recordings. They allow you to observe how people navigate your site, discover bugs and obstacles, optimize forms, and identify patterns that result in people leaving. Now, let’s discuss each of those in more detail.
Observe How People Navigate Your Site
When you observe people using the site you will notice issues that others overlook. People might navigate the site in a loop and not even realize it.
I’ve seen this happen before. Someone was trying to register. They were on the registration page but continued to scroll down to read more information. At the bottom of the page there were links to other pages but the registration options were still at the top. They clicked a deeper link. They kept clicking links to get them closer to registering. Eventually, they landed back on the registration page where they started. They were then ready to buy and successfully purchased. They didn’t express frustration at any point. But, as someone familiar with the site, you watch and cringe thinking about all the extra clicks.
There was a simple solution, add a call-to-action at the bottom of the page as well. The recording session made it obvious that there was a need for improvement even if no one reported it as an issue. A navigation issue like that would never get reported because a site visitor wouldn’t see it as a problem. They are unaware there is an easier path.
Discover Bugs and Obstacles
Watching session recordings can help you identify any bugs or obstacles. Sometimes you’ll notice a person’s experience doesn’t go how you would expect. They tried to click something and it didn’t work. A button didn’t submit, a video didn’t play, or a link went to the wrong page.
When this happens, it’s best to try and recreate the issue yourself to confirm it is a problem. You don’t want to spend time trying to fix an isolated issue that is specific to one person. As soon as you confirm it’s an issue, fix it.
Optimize Forms
Session recordings can also help to optimize forms. Filter the recordings so you can review all the recordings of people who visited the page with the form you’d like to optimize. Watch as many as you can to try and find patterns. Is there a particular form field that is causing confusion? Does everyone leave when they get to a certain point? If so, find a way to make that field less confusing. It might need a different name or a tooltip to add some clarification.
Identify Patterns that Result in People Leaving
One last insight you can gain from reviewing website recordings, is to identify patterns that result in people leaving your site. Do people take similar paths before they leave? Does it seem like they are scrolling up and down the same page struggling to find an answer to a question? If you see patterns that result in people leaving, try to identify how to improve the experience.
In Summary
Don’t let reviewing session recordings take over your calendar. Understand you will almost always capture more than you have time to review. But, spend time monthly reviewing enough recordings to identify patterns. Then, use those patterns to improve the user experience on your site.
Do you want to listen to this article? Here’s the podcast episode:
Looking at heatmap images from pages on your website is fun. There’s lots of color, it seems scientific, but how does it help? You collected this data, you want to analyze it and make sense of it, but what are you looking at? Once you understand heatmaps, you can get deeper insight into how people use your website. Let’s go over six ways to increase conversion rate by leveraging website heatmaps.
What is a heatmap?
Before we can use heatmaps to increase our conversion rate, we need to understand what a heatmap is. A heatmap is a visual representation of data. On a heatmap, values get displayed as a color. Red displays the hottest, most popular, and highest values. Whereas blue and purple show the coolest, least popular, and lowest values.
There are different types of heatmaps. The most common types show click data, mouse movement, and scroll depth. Each of these heatmaps start with a screenshot of the page that is gathering data. The data is then displayed as colors that are overlaid on the image. That allows you to visualize the data while viewing the page. The data collected varies depending on the type of heatmap.
Click Data Heatmap: This displays anywhere people click on the page. The click data is visible even if the element wasn’t interactive.
Mouse Movement Heatmap: This displays where people move their mouse on the page. This is a good indicator of where site visitors are looking and what elements draw the most attention.
Scroll Depth Heatmap: This displays how far down the page people scroll. This is a good way to determine how far most visitors see on the first page load. It can also help you see if anyone is scrolling down to view content at the bottom of the page.
Website heatmaps help you understand where to place your most important content. The data allows you to make intelligent content and page layout optimizations. Those optimizations will increase your conversion rate. Here are six insights you gain from heatmaps.
Optimize Content Length
Do people scroll to the bottom of your 3,000 word article? Do they scroll on shorter articles? Take a look to see where they stop scrolling. Once you understand how far people scroll, you can aim to keep your articles at or below that limit. That way, any call-to-actions at the bottom of the page will be visible to readers before they leave.
Improve Menu Item Placement
Looking at heatmaps can help you identify what menu options are being clicked. Does the order of popularity match the order they appear? If not, you might want to rearrange the menu so the popular items are easy to find. And is there an item that nobody clicks? Try renaming or relocating that item. If it isn’t important to your audience, and no one clicks it, it might not deserve space on the main menu.
Confirm Call-to-Action Visibility
Is your main call-to-action displayed in an area people see? It should be above the fold. What that means, is you want it displayed in the first window people see when they visit your site. People shouldn’t need to scroll to click your call-to-action button. Looking at a scroll heatmap will give you this data.
Better Determine Split Test Winners
Heatmaps can help you make more sense out of split test data. Looking at a heatmap of each variation will give you a visual indicator of how the versions differ. How did the changes impact the user experience?
Intelligently Redesign a Page
Before you redesign a web page, take a look at the heatmap data. Are there any elements being clicked that aren’t clickable? Maybe in the next version you need to incorporate a way people can click and view more details on that item. What about the mouse movements and scroll maps? Is the attention going to the key areas as you had planned? If not, determine what elements are distractions and plan to remove or rearrange those items.
Optimize Mobile Usability
Look at the difference between mobile and desktop. This will be especially important with the scroll depth heatmap. Take a look at where the fold is on mobile. It’s likely much higher than on the desktop version. Is your call-to-action button still above the fold on mobile? You’ll want to also take a look at what gets clicked on mobile. The priorities may differ from desktop users and that may cause the clicks to differ as well.
In Summary
Don’t only collect heatmap data, analyze it. Looking at it allows you to visualize improvements. Oftentimes, finding improvements in heatmaps is far simpler and faster than in tables.
Do you want to listen to this article? Here’s the podcast episode:
Multitasking lowers productivity by 40%! Batch tasks for efficiency, especially in blogging. Boost productivity with our step-by-step guide to batch your blog content creation.Read More